What can Berkeley Lab data tell us about this year's rainfall?
Berkeley Lab weather data includes everything from rainfall charts and 15-minute precipitation totals to storm preparation tips and more.
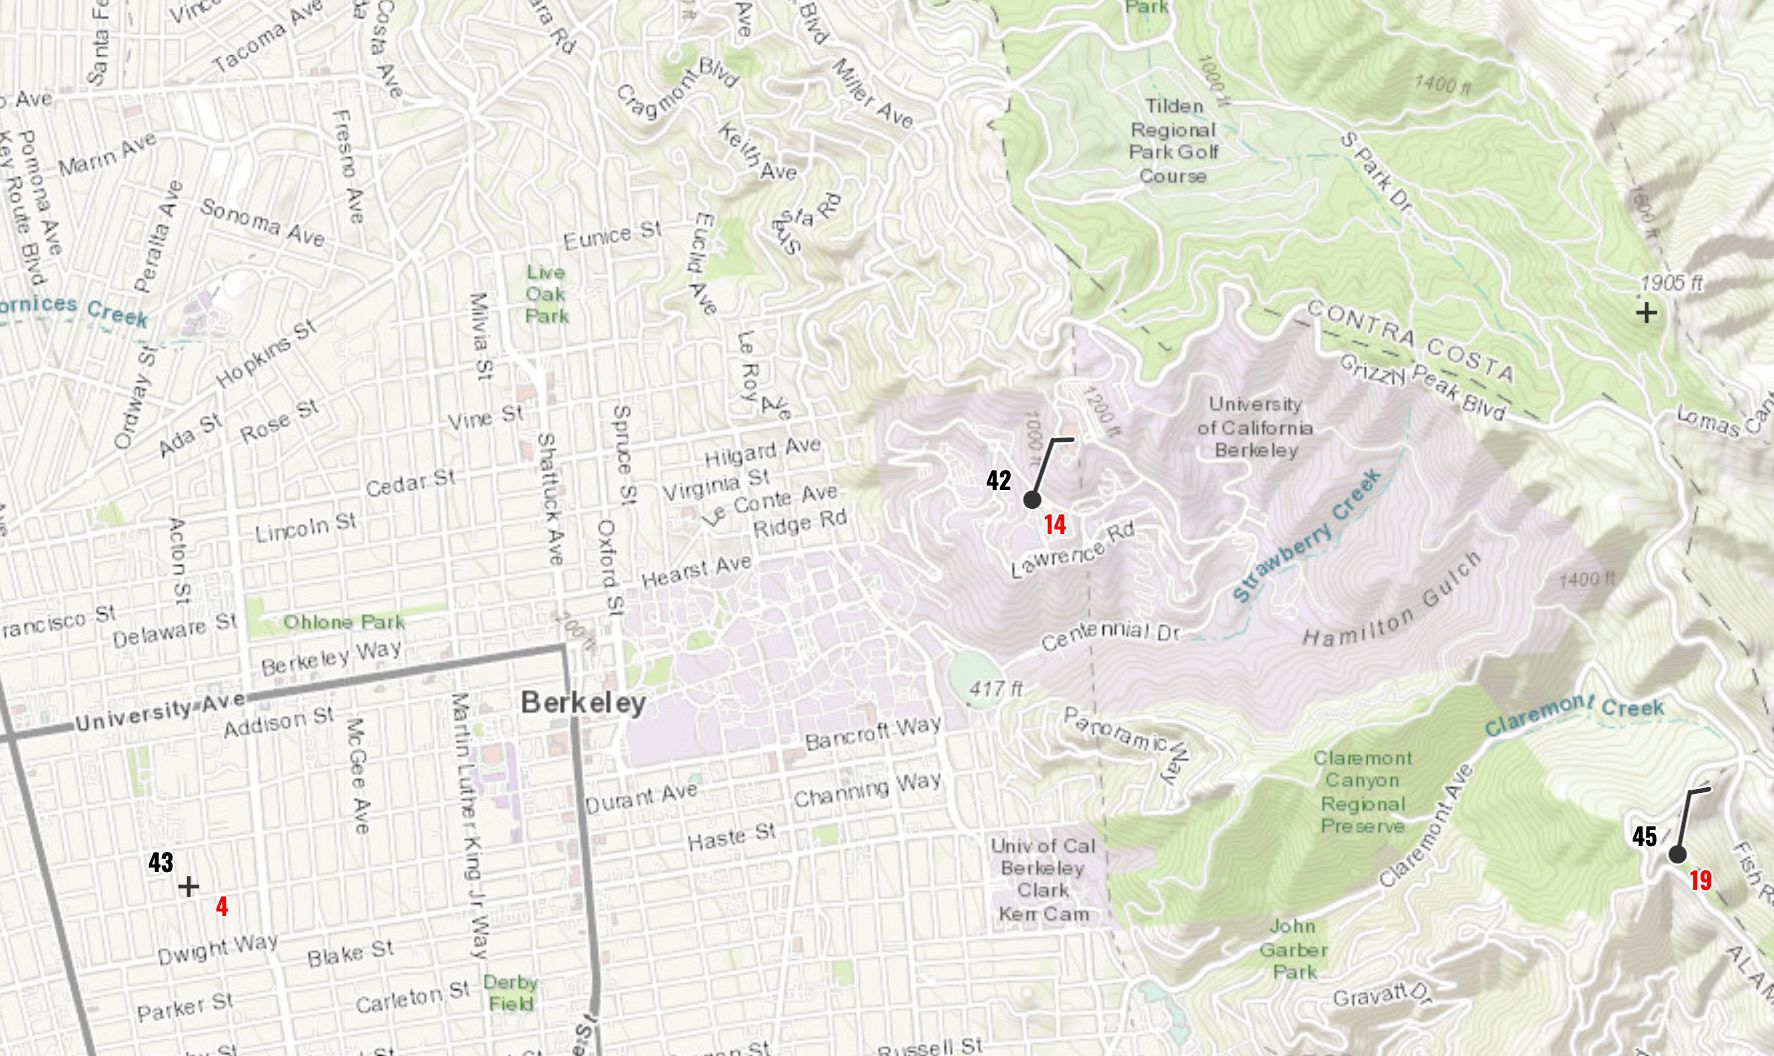
Berkeley has accumulated 24.5 inches of rain this season and is so far keeping pace with its wettest years in recent decades, according to Berkeley Lab weather data from its tower on Cyclotron Road.
The Lawrence Berkeley National Laboratory makes a wealth of weather data available to the public on its weather data website. That includes everything from rainfall charts and 15-minute precipitation totals to storm preparation tips and other local weather resources.
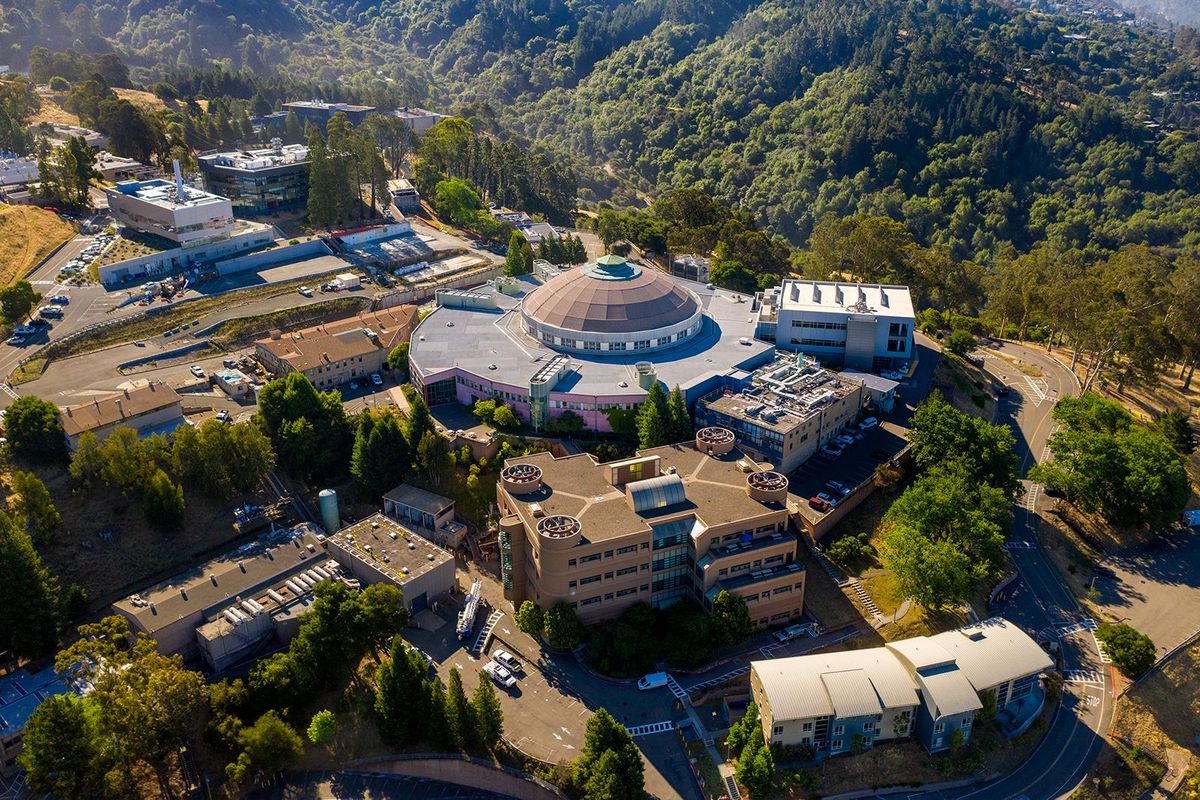
Berkeley Lab's weather station gets its data from an 85-foot tower near the Advanced Light Source at 1 Cyclotron Road in the Berkeley Hills.
Last week, as storms raged in Berkeley and around the state, lab staff took a look at historical data from the weather tower to see how the 2022-23 "rain year" was shaping up.
As background, lab experts cautioned that tower data reflects only what happens at its specific location on Cyclotron Road. It should not be generalized to the rest of the city.
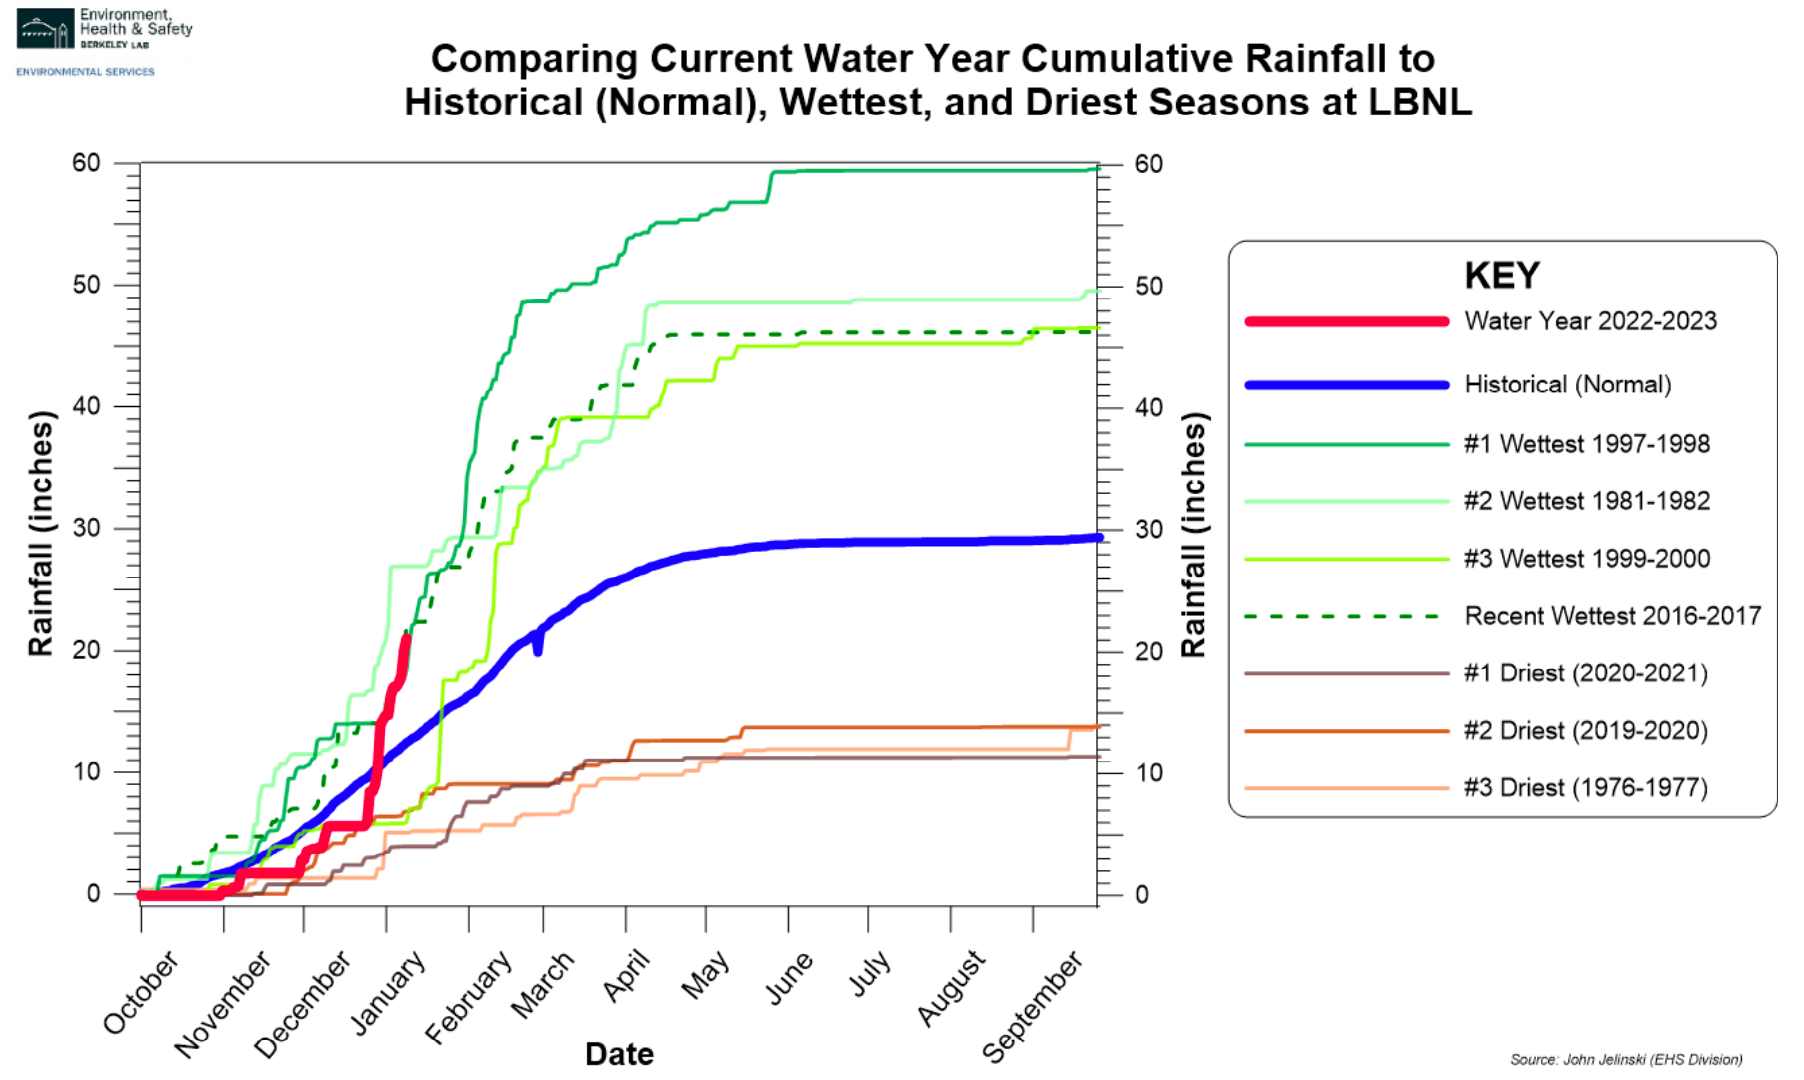
Unlike the calendar year, the rain year in California begins Oct. 1. Since then, tower data shows 24.5 inches of rain in Berkeley.
Berkeley doesn't usually get to 24.5 inches of rain until mid-March, according to historic lab data.
Over the past 30 years, Berkeley has averaged about 29 inches of rain a year, according to lab data, accumulating most of its precipitation from October through April.
As of early last week, Berkeley was already at 170% of its normal precipitation for this time of year.
According to the lab's seasonal rainfall data, Berkeley is pretty much keeping pace with its wettest years on record since at least the 1980s — although lab experts cautioned that a plateau could come at any time.
Last year, for example, Berkeley got about 25 inches of rain through January then mostly plateaued for the rest of the rain year.
During the wettest year on record, 1997-98 according to lab data, Berkeley accumulated about 60 inches of rain.
The next wettest year for Berkeley was 1981-82, when Berkeley precipitation totals reached 50 inches, according to lab data.
The most recent of the wettest years on record was in 2016-17 when Berkeley topped out at 46 inches of rain for the year.
Berkeley Lab is one of just three Berkeley sensors to push weather data to the University of Utah's MesoWest site, where you can download historic weather data from the lab broken down into 15-minute chunks.
(The other sensors are north of Tunnel Road on Vicente Road and in southwest Berkeley on Valley Street just north of Channing Way.)
Since the rain year began Oct. 1, 2022, according to data from MesoWest, Dec. 31 was the rainiest date in Berkeley — with 3.61 inches of rain — followed by Dec. 27 with 2.41 inches.
Berkeley got less than 2 inches of rain in November 2022 followed by almost 12 in December.
January is already up to nearly 11 inches of rain, according to the lab sensor, with two more weeks to go.
The most user-friendly page from the lab about current weather data includes graphics showing temperature, wind direction and humidity as well as precipitation over the last seven days.
Berkeley Lab weather tower is routinely audited for accuracy
John Jelinski, of Berkeley Lab's Environment, Health & Safety Division, said the lab collects weather data as part of its emissions and stormwater monitoring requirements along with other programs.
Jelinski pointed out that the lab's weather tower is audited twice a year to ensure accuracy. Staff also checks the sensors monthly for the same reason.
"It's a fairly rigorous quality control standard," he said.
Other sensors in Berkeley show a range of rain totals since Oct. 1: one in Tilden Regional Park shows that Berkeley has had nearly 32 inches of rain; the one north of Tunnel Road puts the total at 20.35; and the one in southwest Berkeley puts the accumulation at 22.74 inches.
The San Pablo Bay Watershed, which includes Berkeley, has received 25.37 inches of rain since Oct. 1, according to California Water Watch.
Statewide, reservoirs are at 97% of average levels, according to California Water Watch.
And the California snowpack is at 245% of normal for this time of year, according to state data.
SFist took a look at the state of the reservoirs over the weekend for those who'd like to know more.
This week's Berkeley weather forecast
Berkeley is currently slated to see some rain Wednesday, according to the National Weather Service, with less than a tenth of an inch possible during the day and somewhere between a tenth and a quarter of an inch at night.
The rest of the week is projected to be sunny and clear.
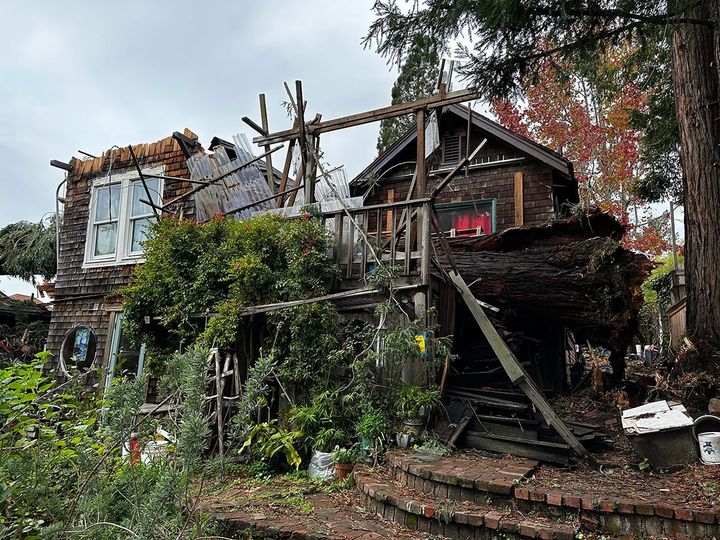
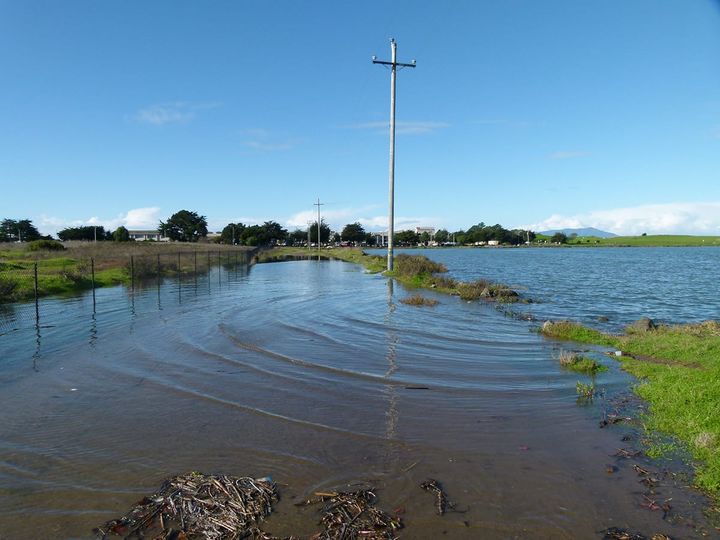
A coastal flood advisory covering the North Bay down to Big Sur is in effect in Berkeley from 6 a.m. Thursday until 3 p.m. Monday.
Much colder temps this week with many areas dropping into the 30s at night. Be sure to protect people, pets, plants, and pipes from the cold! Minor coastal flooding also a concern into the weekend with heavy runoff from recent rains combining with higher tides. #cawx pic.twitter.com/oI16z1Wnof
— NWS Bay Area 🌉 (@NWSBayArea) January 17, 2023
During that time, minor coastal flooding is expected, according to the weather service, including the "flooding of lots, parks, and roads with only isolated road closures expected."
"The combination of high tidal cycles, onshore winds, and heavy runoff will likely lead to coastal flooding in locations prone to tidal flooding," according to the advisory. "This potential may persist into this weekend during high tide cycles, especially during each morning's high tide."
Read more about Berkeley weather impacts on The Berkeley Scanner. Note: Statewide snowpack and reservoir data were updated after publication for clarity.