Explore Berkeley traffic data on the BPD Transparency Hub
The new traffic data joins other interactive pages on the Transparency Hub about crime, police stops, calls for service, uses of force and trends.
The Berkeley Police Department is making it easier for people to learn about local collision data through a new traffic safety page that launched this week.
It's now simpler to see at a glance, for example, that injury collisions in Berkeley were up 16% at the end of 2022 compared to the prior quarter while bicycle collisions were down 9%.
The current iteration of the traffic data page, which went live Monday, may need some refinement. Why emphasize quarterly changes over year-over-year data for example?
But it does give users many compelling ways to look at Berkeley traffic data for the first time. And that's something to celebrate.
"The page was developed with the goal of supporting informative, constructive, and relevant conversations about how we can improve traffic safety in the city we serve," the city said of the new traffic data page, which appears on BPD's Transparency Hub.
The traffic data page joins other interactive pages on the Transparency Hub about crime, police stops, calls for service, uses of force and current trends.
The page also includes relevant context about how the city approaches traffic enforcement (there's a "three-prong approach" that involves traffic violations that result in death or serious injury, community concerns submitted to BPD and other types of safety violations).
The traffic data page also makes it easy to find out more about the city's Vision Zero campaign to end traffic fatalities and serious injury collisions in the coming years.

How do you navigate BPD's Transparency Hub?
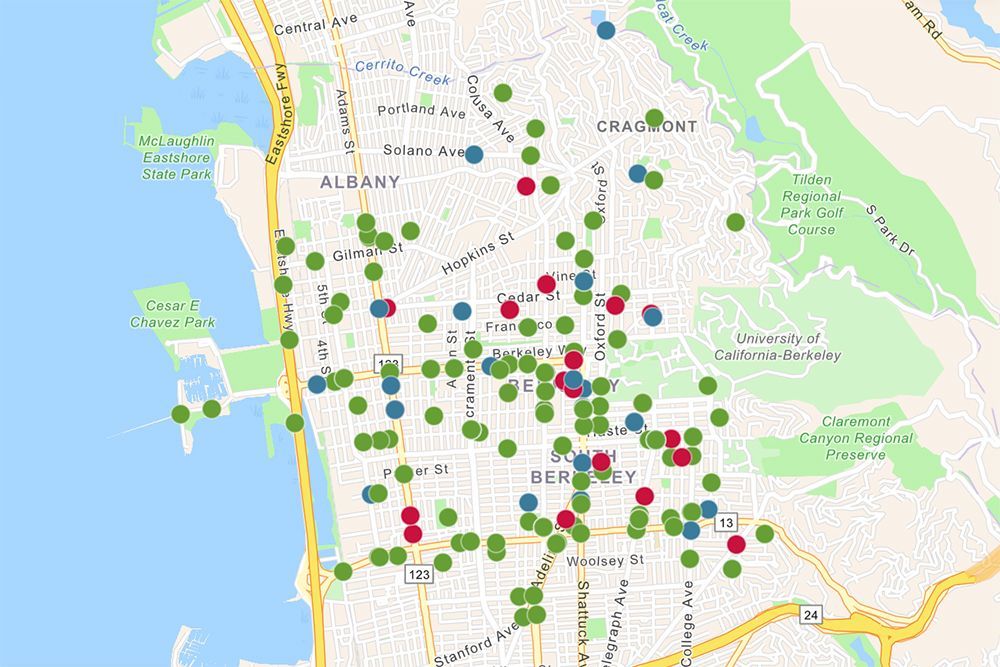
All of the Transparency Hub's data pages follow a similar format, with a "snapshot" map view at the top of the page followed by a more detailed dashboard down below.
On the traffic data page, the first map currently allows users to compare the final quarter of 2022 to the third quarter of the year as well as to the fourth quarter of 2021.
The snapshot view will update to the first quarter of 2023 when that dataset becomes available.
The dashboard down below (keep scrolling!) allows users to drill into the data by choosing among several tabs, selecting a date range and filtering to view different types of injury collisions.
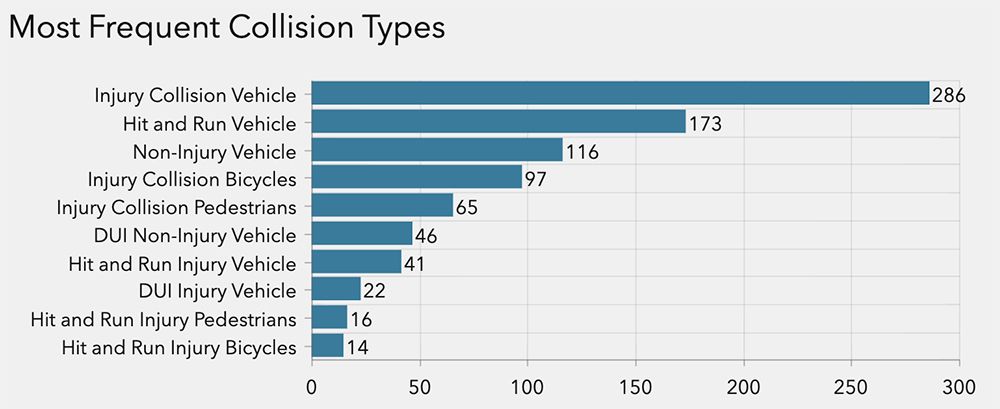
You can click on the collisions tab, for example, to get a high-level view of injury crashes dating back to 2017.
You can quickly filter for different types of collisions as well as whether they involved pedestrians or cyclists.
You can pull up data for 2022, for example, and see that there were 286 injury collisions, including 97 that involved cyclists and 65 that involved pedestrians.
It's worth noting: Some number of those cyclist crashes are likely solo crashes but, in its current iteration, there is no way to determine that through the Transparency Hub. You would need to get the raw data from BPD.
Perhaps most critically, there is no way to filter collisions by injury severity, despite high and longstanding community interest in that information.
And there are some other drawbacks, too, which hopefully will be addressed in time.
There is no way to export any of the BPD traffic data to a spreadsheet, which is a common feature of most online data hubs.
And, to see information about all of the fatal crashes, you need to select multiple categories. "Fatal collisions" alone doesn't cut it. (We've asked BPD if this can be tweaked.)
You also can't see how many people died or where the collisions took place.
Some of the information is also just confusing on its face, including the map that is supposed to illustrate the frequency of traffic stops and traffic-related calls by using different-sized lines in two colors.
The information is there but it's just not entirely clear what it means or why it's significant. University Avenue sure seems to be getting a lot of attention though.
How to reach BPD's traffic unit directly
On the bright side for Berkeley residents, the folks behind the Transparency Hub are extremely responsive and open to community input.
And, for those interested in BPD collision data, there are many different statistics available on the new traffic page and through its interactive elements.
Being able to look at various aspects of Berkeley traffic data dating back to 2017 should provide many useful insights.
A person could lose hours exploring the traffic data and looking at it in different ways.
And that's true for the rest of the Transparency Hub as well.
There's also a somewhat hidden feature that may well prove popular: The traffic data page includes a form community members can fill out to report incidents or areas of concern directly to the Traffic Bureau.
Those reports appear on the dashboard map with a yellow flag. It will be interesting to see how the community uses that feature over time.
More Berkeley traffic collision data online
For those interested in local traffic collision data, UC Berkeley has an excellent site called the Transportation Injury Mapping System and the California Highway Patrol also has a database called SWITRS.
Berkeley Library has also collected transportation data and statistics on its website.